
LATAM Visa grants
Student Visa · Subclass 500 · Data Analysis
Brazil is the LATAM story nobody is telling
Colombia is well understood. Brazil VET sliding from 99.9% to 72.1% is not.
Six-year analysis of subclass 500 grant rates across Brazil, Chile, Argentina, Colombia, and the rest of Latin America. Source: DHA BP0015, locked at 31 March 2026.
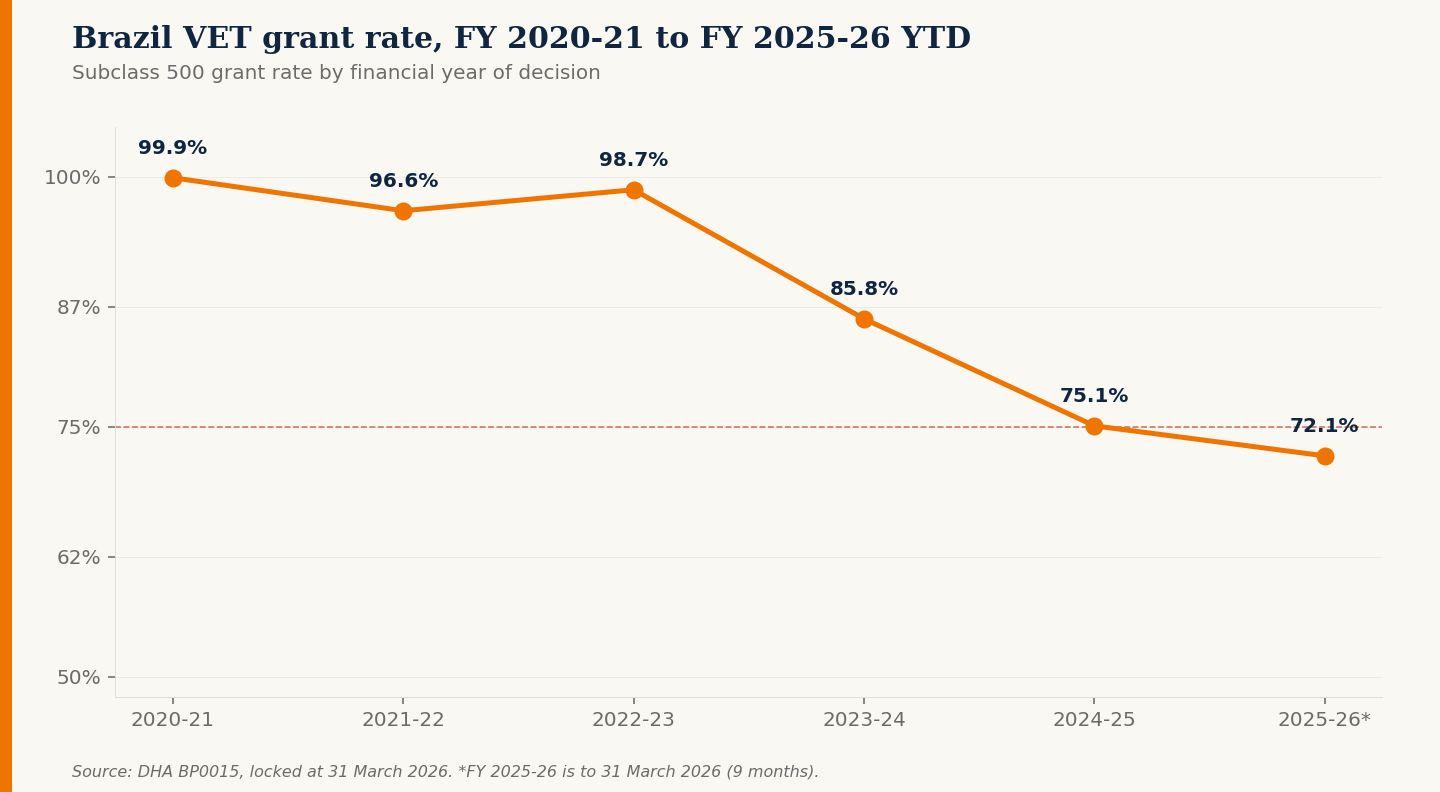
Brazil. Student visa subclass 500. Vocational education sector.
Grant rate this financial year to date: 72.1%. Five years ago it was 99.9%. That is the story nobody is talking about in Latin America right now.
Colombia is well understood. Anyone working in the sector knows about the protection visa pipeline and the financial documentation issues that have pushed Colombia VET to 57.1% year to date. The Colombia number is not a surprise to people in the room.
Brazil is different. Brazil is the supposed clean LATAM market. The diversification play. The growth story that providers have been quietly betting on for two years. And it is now being decided at 72.1%.
The volume context
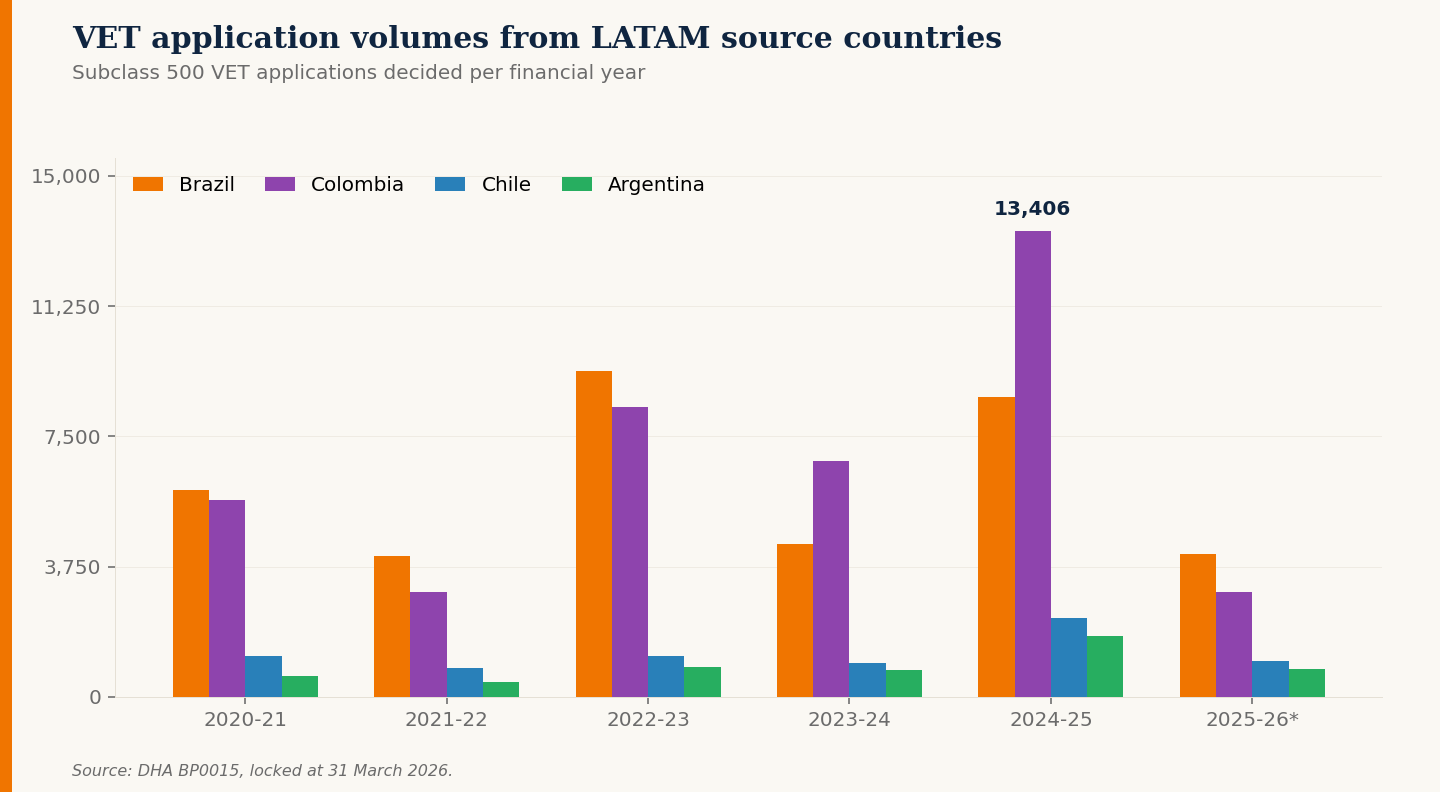
This matters because of how large the Brazil VET channel has become. In FY 2024-25, Brazilian students accounted for 8,637 of the LATAM VET decisions, second only to Colombia (13,406). That is a meaningful share of the entire LATAM enrolment pipeline into Australian VET providers.
The volume curve and the grant rate curve are now moving in opposite directions. Brazil VET applications more than doubled from FY 2020-21 to FY 2022-23, then doubled again into FY 2024-25. Over the same window, the grant rate fell almost thirty points.
It is one channel, not a country problem
The headline Brazil grant rate of 80.4% year to date is misleading. Strip out VET and ELICOS and Brazil looks like a clean market: Higher Education at 91.2%, Postgraduate Research at 100%, Schools at 99.5%, Non-Award at 100%.
The pressure is concentrated in two sectors. VET is carrying the brunt of it.

Same region, very different outcomes
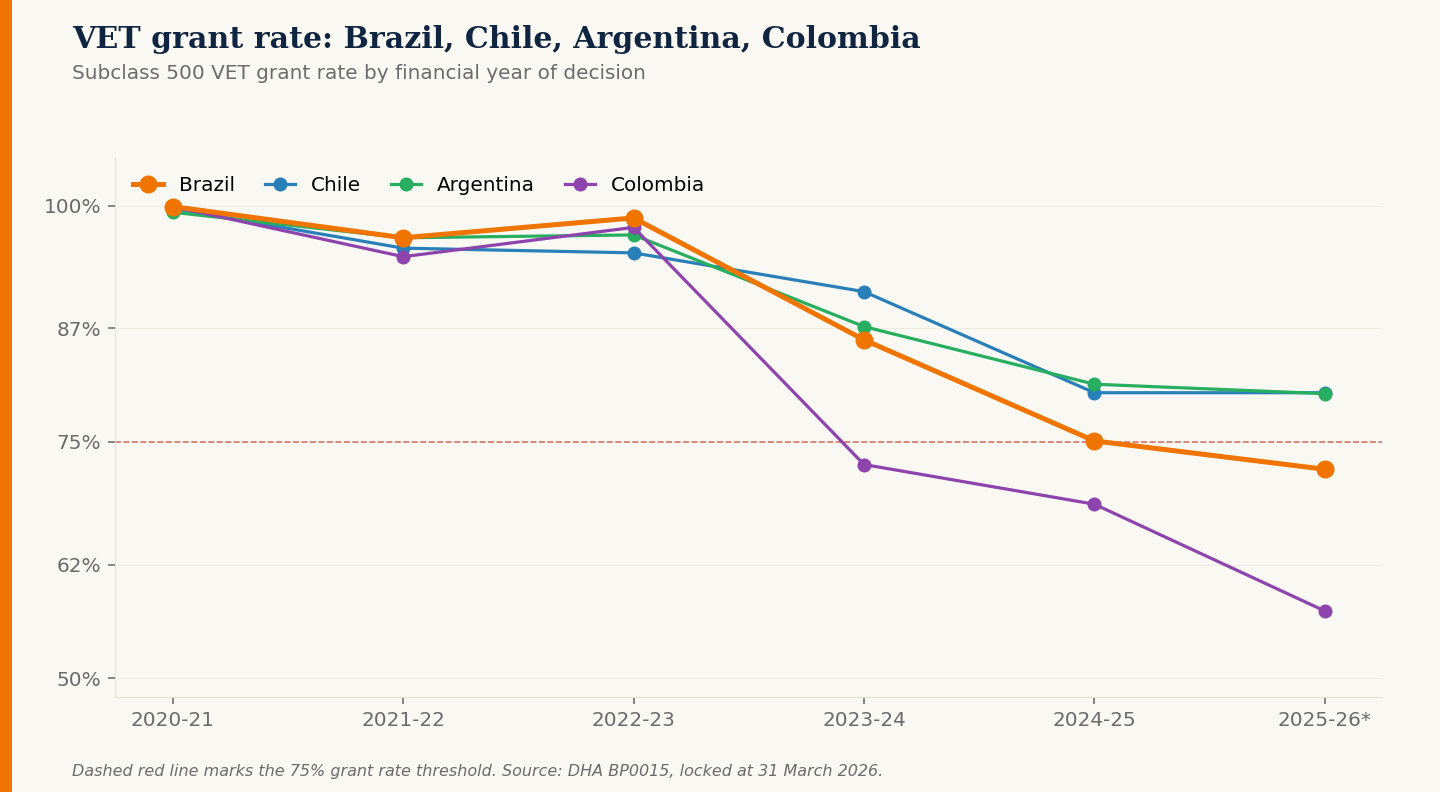
If this were a regional issue, we would expect the four largest LATAM source countries to track together. They do not.
Chile and Argentina VET grant rates have held at around 80% across FY 2024-25 and FY 2025-26 YTD. Brazil sits eight to ten points below them. Colombia is in a category of its own. The Genuine Student framework is the same. The evidence level architecture is the same. The case officers are the same. Something specific to the Brazilian and Colombian VET pipelines is producing this result.
Why this matters for VET providers
If you are a VET provider with Brazilian recruitment, the country aggregate is hiding the actual signal in your channel. The 80.4% Brazil total reads as healthy. The 72.1% Brazil VET grant rate is not.
There are three things this dataset is consistent with, and any of them would explain part of the pattern. Agent practices that were tolerated when grant rates were 95%+ are now driving refusals. The Brazilian middle-class pipeline is presenting profiles that the Genuine Student framework is reading differently than it did three years ago. Or the volume expansion itself widened the cohort enough that the marginal student is being captured by tightened evidence requirements.
All three are plausible. None of them are visible at the country-aggregate level. The providers who notice this pattern in the data before they notice it in their enrolment numbers are the ones who will adjust agent agreements, lead qualification, and offer-letter discipline early enough to matter.
The point
Country aggregates conceal sector concentration. A LATAM grant rate of 78.6% in FY 2025-26 YTD understates the position for Higher Education at 94%+ and overstates it for high-volume VET applicants from Brazil and Colombia. The aggregate is a comfort metric. The sector-by-country breakdown is the operational one.
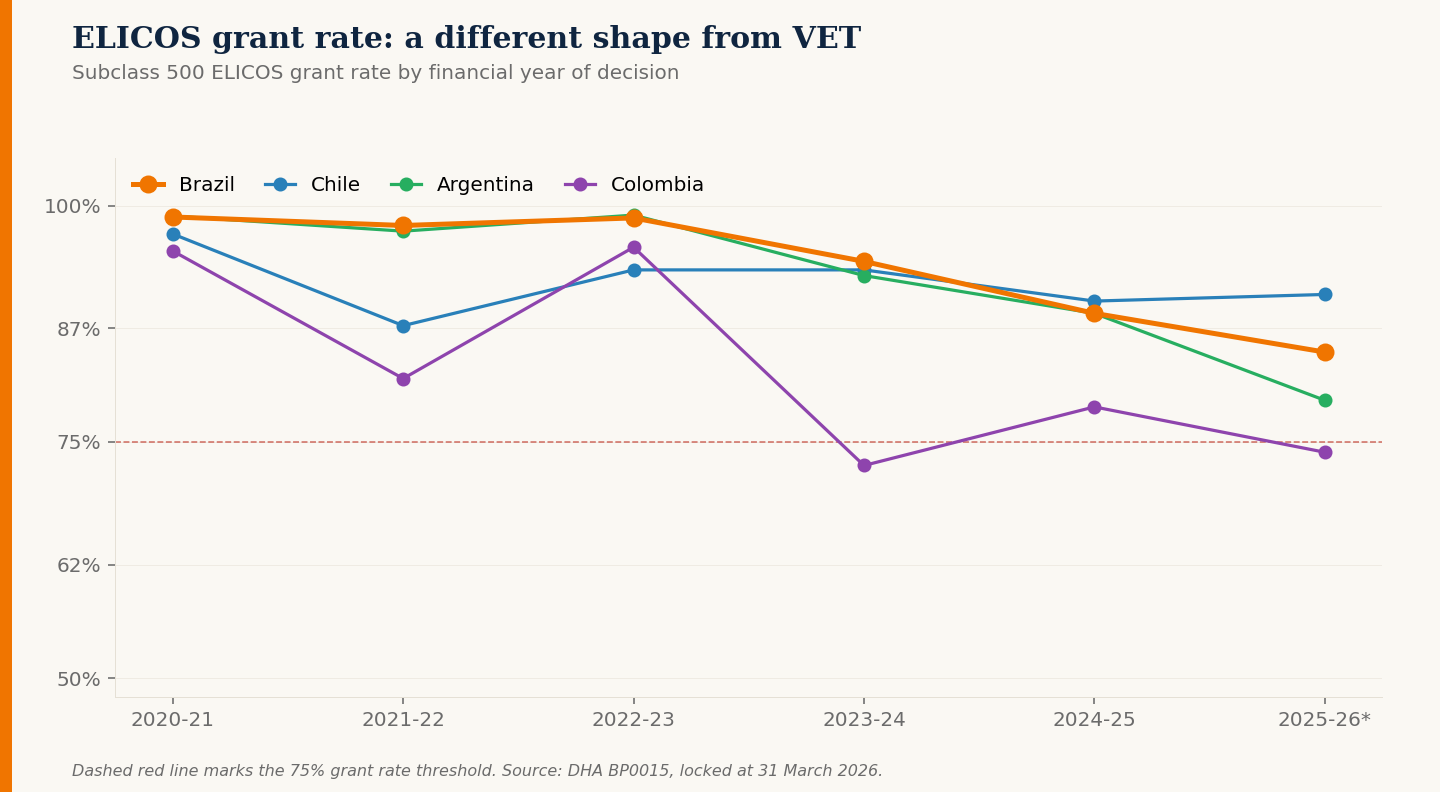
ELICOS tells a different story
VET is where the grant rate problem lives. ELICOS is where the volume story lives, and the two patterns are worth understanding separately.
Between FY 2020-21 and FY 2022-23, Colombian ELICOS applications grew from 930 to 28,248. Brazilian ELICOS went from 693 to 13,537 over the same window. That is not a market expanding. That is a market being engineered, almost certainly by aggressive agent-led recruitment into short-course English programmes that functioned as visa entry points rather than language study.
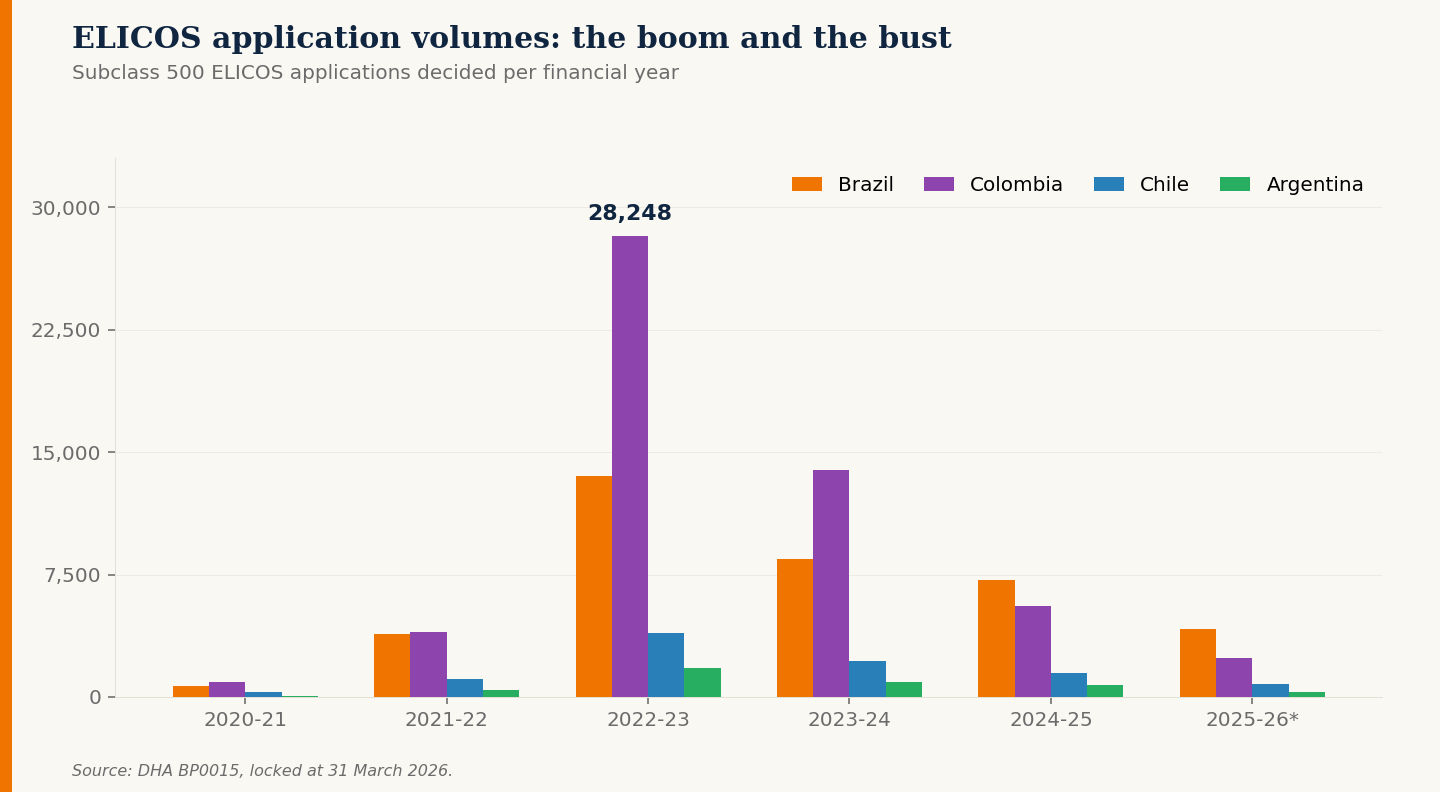
The bust is now well underway. Colombia ELICOS volumes are down 92% from peak. Brazil ELICOS is down 69%. Argentina and Chile, which never participated in the boom at the same scale, have come off more gently.
The grant rate story across this cycle is more nuanced than the VET trajectory. Three observations stand out.
Three things the ELICOS data shows
1. Argentina is the late entrant to refusals. Argentina ELICOS held above 92% through FY 2023-24 and then dropped to 79.4% in FY 2025-26 YTD. That is the steepest single-year fall of any LATAM country in this dataset. It does not yet have a clear cause, but it is the line on the chart that has changed direction most recently.
2. Chile is the only ELICOS market improving. Chile ELICOS dipped to 87.3% in FY 2021-22 and has climbed back to 90.6% in FY 2025-26 YTD. It is the only country in this group with a recovering trend rather than a deteriorating one.
3. Colombia ELICOS is volatile, not just declining. Unlike Colombia VET, which has fallen in a near-straight line, Colombia ELICOS has moved 95% to 82% to 96% to 73% to 79% to 74% across the six years. The volatility itself is the signal: case-by-case decisions, large variance year on year, very different cohort profiles flowing through.
What the ELICOS picture means for providers
For ELICOS providers, the volume collapse is the dominant operational reality. Colombia ELICOS decisions fell from 28,248 in FY 2022-23 to 2,360 in the first nine months of FY 2025-26. That is the kind of move that determines whether a centre stays open.
For VET providers using ELICOS as a package, the implication is different. The ELICOS-into-VET pathway from Brazil and Colombia is now decided at materially lower grant rates than direct VET applications from the same source countries. Package CoEs that worked in FY 2022-23 are not the same product in FY 2025-26.
For agents, the read-across to recruitment strategy is most relevant in Argentina. The country has been the quiet diversification target for two years. The 79.4% ELICOS grant rate for FY 2025-26 YTD is a signal that the assessment posture toward Argentine ELICOS applicants has shifted recently. Agent practices that worked in 2024 may not work in 2026.
Where the rest of LATAM sits
Three observations close out this analysis.
First, Chile and Argentina VET grant rates of 80.2% and 80.1% in FY 2025-26 YTD are not great but not in crisis. They are higher than Brazil by a meaningful margin and have been stable for two years. For providers looking to rebalance their LATAM portfolio, these are the markets where the data supports continued investment.
Second, the smaller LATAM markets aggregated as Rest of LATAM (Mexico, Peru, Ecuador, Venezuela, and 11 others) sit closer to Chile and Argentina than to Brazil and Colombia. Mexico in particular held a 94.8% grant rate across FY 2024-25 on 2,929 decisions. Mexico is the cleanest large LATAM market right now.
Third, the trajectory of the Brazil VET line in the chart above is the one worth watching. Three consecutive financial years of decline, and the slope has not flattened. If FY 2026-27 produces another five-point drop, Brazil VET will sit alongside Colombia at the bottom of the LATAM ranking.
Free download
LATAM student visa report, FY 2020-21 to FY 2025-26 YTD
12-page landscape report. Applications, grants, refusals and grant rates by sector for Brazil, Chile, Argentina, Colombia, and Rest of LATAM. Every financial year. Sourced directly from DHA BP0015, locked at 31 March 2026.
View report details